
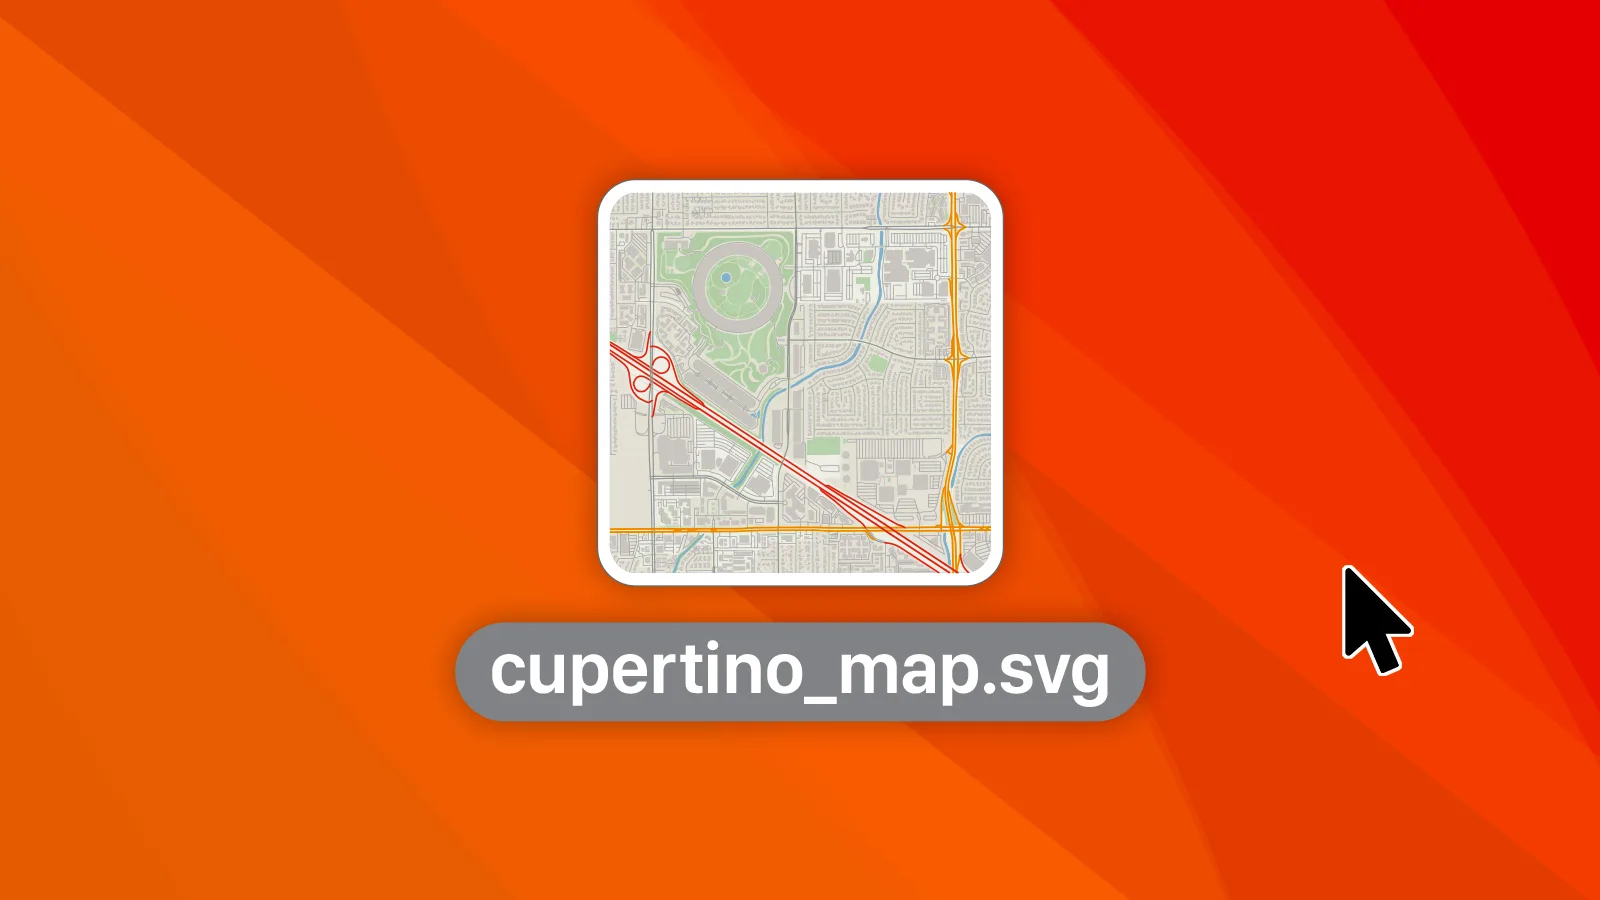
If you need a map as an SVG file, you've probably discovered that there's no simple export button for it. Google Maps won't give you one, and neither will Mapbox, Apple Maps, or any other services built for navigating.
Technically, most GIS tools do allow SVG export, but not in a state any designer would want to open. Here's what's actually going on, and how to skip the painful part.
The problem with map data
Map data and design files speak two different languages:
Geographic formats like GeoJSON, Shapefile, and OSM are built for analytics. They store coordinates and attributes, rather than paths and strokes. These datasets are generally rendered as tiles – something completely useless if you’re looking for vector maps.
SVG (scalable vector graphic) files on the other hand, store paths, fills, and strokes, using mathematical formulas. If you’ve ever opened an SVG file in a text editor, you’ll have seen the text-based XML instructions and formulas that define each shape, line, curve, and color in your file.
Converting between these two formats is possible, and there are tools that let you export SVG from QGIS. But the output tends to be made for analytical use, often requiring a technical understanding of GIS data.
Files arrive as thousands of unnamed paths in a flat structure, with labels converted to geometry, styling that bears no resemblance to what you saw on screen, and a file heavy enough to slow Illustrator to a crawl. You've technically exported map data as SVG. You now have hours of cleanup ahead of you.
Export map data to SVG with MapVG
As a graphic designer myself, being able to export vector maps directly from the source was a process I wished existed for many years. When I couldn’t find anything that suited the needs of a designer – something that didn’t require a degree in data processing – I decided to build it myself:
MapVG generates vector maps directly from OpenStreetMap source data, and it couldn’t be easier and faster to vectorize maps:
Pick your location.
Choose what layers to include.
Export your map as SVG.
SVG maps for creatives, not analytics
I built MapVG for creative projects – graphic and print design, engraved and laser-cut maps, and architectural visualization – rather than analytics and data processing.
The output file is structured the way you'd build it yourself: roads, water, buildings, parks, and labels on separate named layers, so you can restyle anything without hunting through anonymous paths.
SVG maps from MapVG contain real vector geometry that scales to any size, editable text, and clean line work that holds up in print at any dimension. Every output file opens in Illustrator, Figma, Affinity, or anything else that reads SVG – and it opens fast, because the file isn't carrying nonsense data you'll never need in your design project.
Exporting SVG maps with MapVG takes seconds, and requires no GIS knowledge, no cleanup phase, and no manual tracing of roads.
Try it yourself
The fastest way to judge whether MapVG is the right map-to-SVG solution for you is to export a map and open it.
MapVG is free to try: head to the MapVG editor, pick a location you're working on, export the SVG, and see how it behaves in your own tool with your own workflow.
Happy map making!